Network monitoring with Grafana and Prometheus
Quobis has designed a dedicated monitoring tool based on the most successful tools for monitoring: Grafana, Prometheus and Loki. It takes part in the Quobis Manager license and we are going to deep dive on its components.
Quobis Monitoring as a Service
Why is it important to know the health of your network?
Systems administration must include a good monitoring system to gain efficiency. Knowledge of how the systems have been deployed and their configurations is important to act if necessary. There are a lot of tools that provide detailed information on each point of physical servers, virtual servers, Linux systems, databases, etc. All the data that we keep in the monitoring systems and logs are really important to predict problems and also to be proactive.
- You can know in detail the performance of your services.
- You can have alarms to detect any problem.
- To have a centralized system of logs and if it is one in real-time.
- Monitoring allows you to detect the origin of the incidents.
- The statistics that you will have over time will give you a vision of when your needs rise or fall.
- Thanks to this data, you can anticipate and optimize your systems in the future.
What tools do we have available?
Nowadays there are many tools for monitoring systems and services, some of the most successful are Grafana and Prometheus:
Grafana
Grafana allows you to query, visualize, alert on and understand your metrics no matter where they are stored. Create, explore, and share dashboards with your team and foster a data-driven culture.
Grafana is the de facto software for time series analytics, with well over 400,000 active installations. Customers turn to Grafana Labs to help bring their disparate data sources together, all through software that is vendor-neutral and open source.
Grafana is used in a wide variety of use cases. These include DevOps, IIoT, and AdTech. Our community is constantly inspiring us with new use cases and applications.
Prometheus
Prometheus is an open-source system monitoring and alerting toolkit originally built at SoundCloud. Many companies and organisations have adopted Prometheus, and the project has a very active developer and user community. It is now a standalone open source project and maintained independently of any company. To emphasise this, and to clarify the project’s governance structure, Prometheus joined the Cloud Native Computing Foundation in 2016 as the second-hosted project, after Kubernetes.
- Go-based, simple deployment model.
- Embedded Time Series Database
- Flexible data model based on tags (K/V pairs).
- Powerful query language (PromQL).
- Many Client Libraries and integrations available.
- Prometheus fundamentals:
- Checking CPU, Memory and Disk is not enough.
- Monitoring should not be limited to services inputs and outputs.
- Instrument business logic and fine-grained service stats.
How do Quobis monitorize networks health?
In order to obtain the data and metrics from service by Prometheus, it needs an exporter: A Prometheus exporter is the software responsible for collecting the metrics of a service or system, such as CPU, RAM, etc. and store them in the appropriate format for Prometheus.
- A service which exposes metrics from another service via HTTP.
- Exporters can be used if direct instrumentation is not available.
- Find exporters by checking the Prometheus website.
- Use node_exporter for machine-level data incl. Memory, CPU, detailed Network and IO metrics.
Therefore, we need exporters to acquire metrics, store them in Prometheus and then visualize them with Grafana. There are a wide variety of exports with specific functionalities, such as for monitoring CPU and RAM consumption.
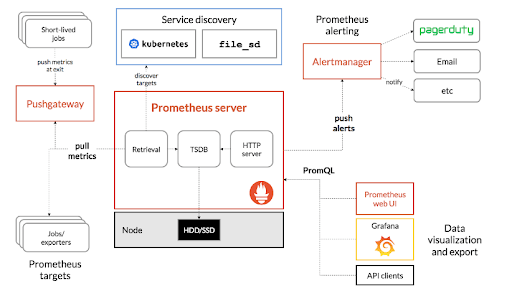
This diagram illustrates the architecture of Prometheus and some of its ecosystem components:
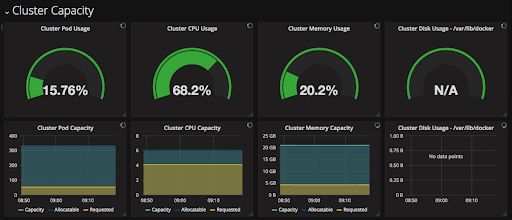
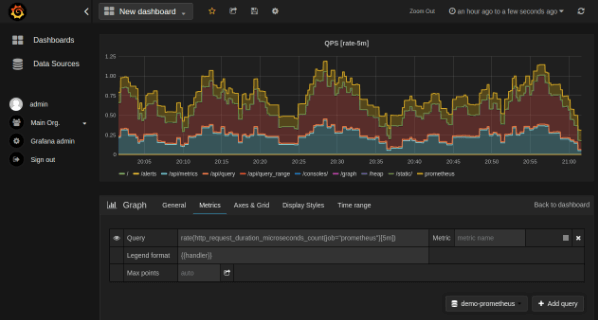
In the following image we can see the Grafana web interface, showing graphs of data stored and processed in Prometheus, which have been saved through an exporter:
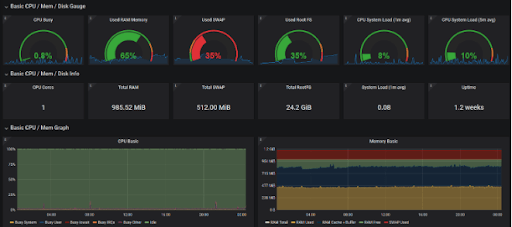
Grafana presents a lot of options to show statistics:
The value of Quobis Manager inside Quobis Communication Platform
Quobis Manager is the backoffice for Quobis Communication Platform. In addition to user management, Quobis Manager allows Network Administrators monitor all system, taking advantage of Grafana and Prometheus.
Quobis Communication Platform is deployed using Kubernetes. In addition to user management, Quobis Manager allows full monitoring of the system, including Kubernetes, which has its own exporters to be able to expose useful information to the user.
Among some of them, there is the measurement of users identified on the platform, registered users and conferences or active users, among others.
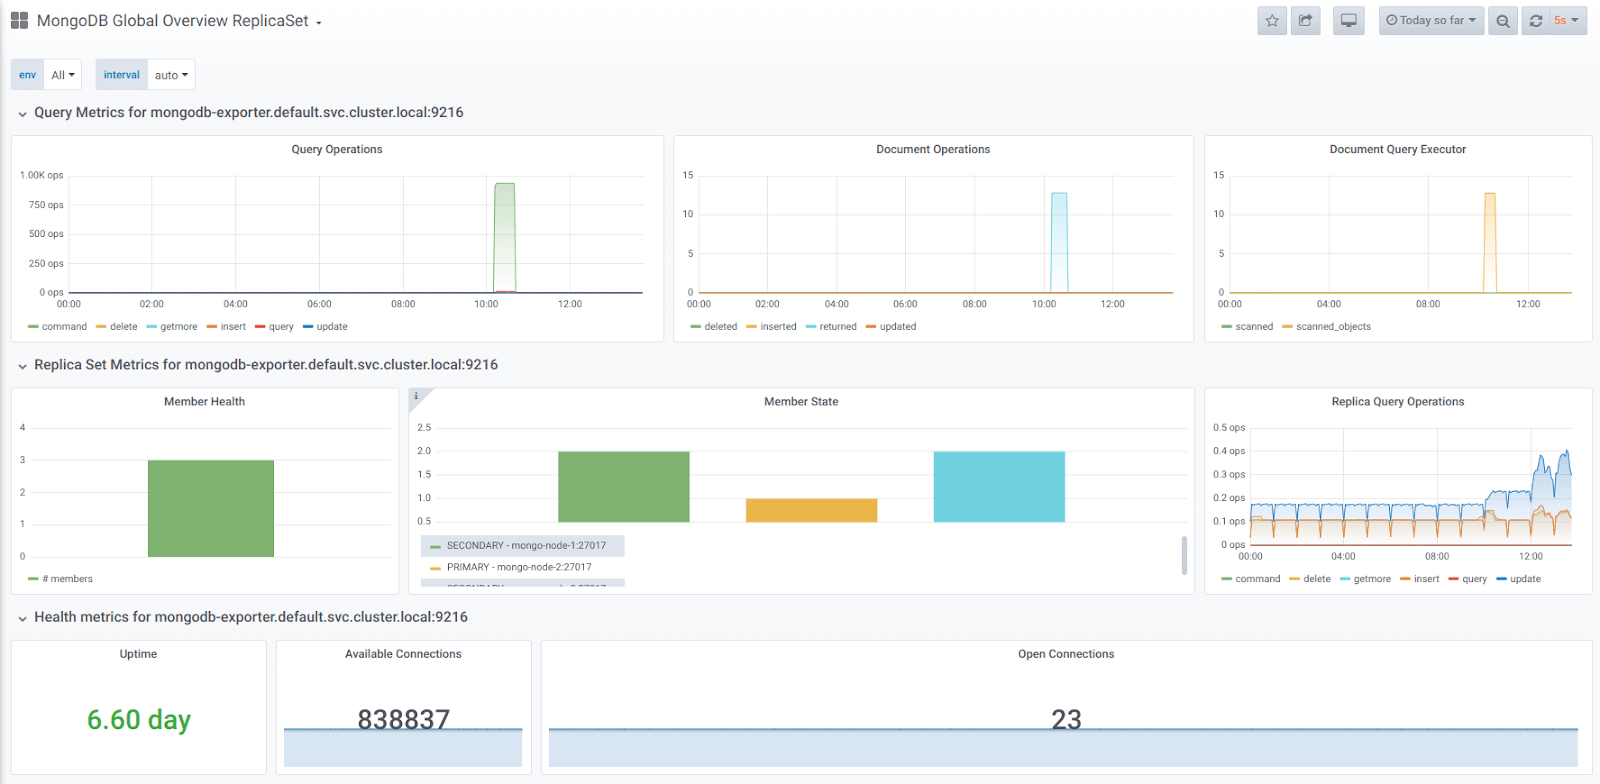
Quobis Communication Platform uses MongoDB as a database, installing it in a ReplicaSet to manage high availability. Grafana can show the status of the database cluster:
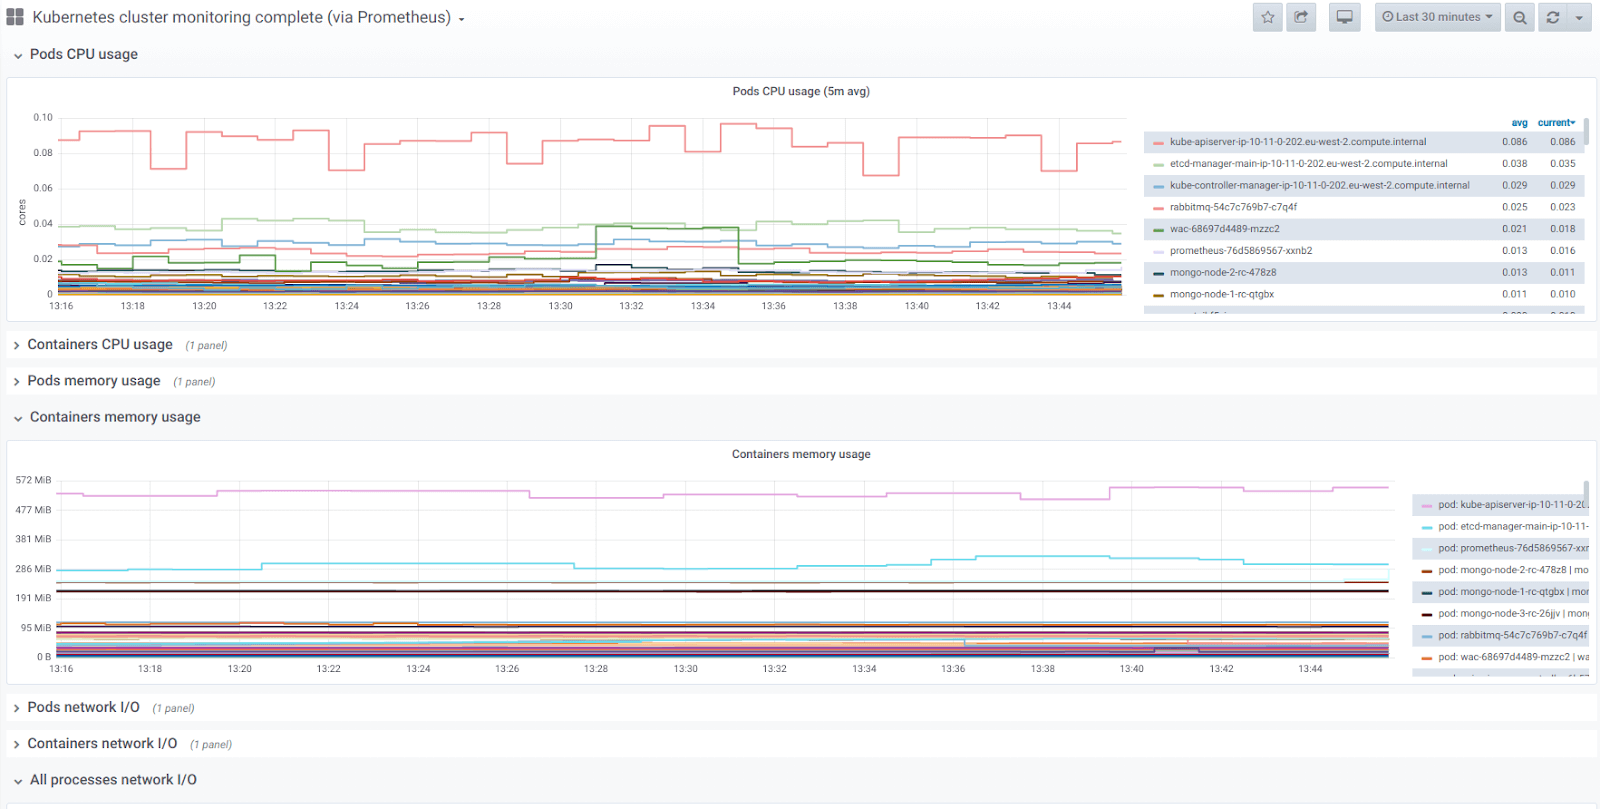
Grafana shows the CPU and RAM status for each Pod. Due to Quobis deploys its services in a Kubernetes cluster, we can monitor the consumption of each service as you can see in the following image: